“How AI Dashboards Change Efficiency — NexaSight”

NexaSight Vision Analytics Dashboard for Senior Living Facilities (US)
October 22, 2025Transforming Franchise Hotels with AI-Driven Efficiency
November 5, 2025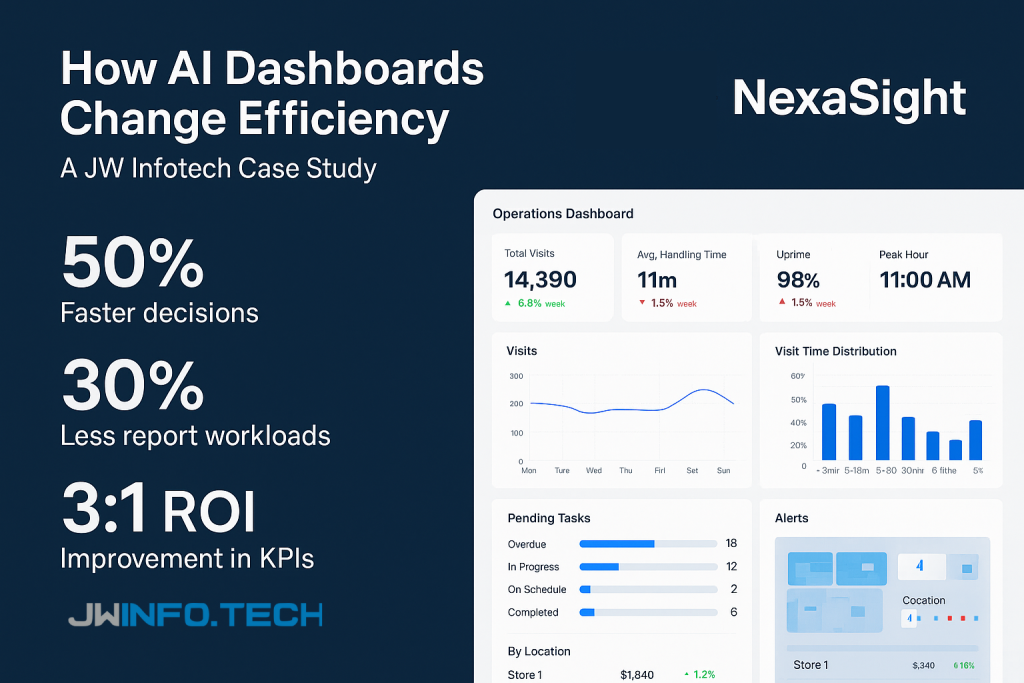
Organizations that adopt AI-enabled dashboards for operational and vision analytics see faster, data-backed decisions, reduced manual reporting, and clear ROI when pilots are scoped to business outcomes. This JW Infotech case study explains the analytics approach, typical efficiency gains, and a practical implementation roadmap for teams that want to convert live video and telemetry into measurable business value. Real-world research shows strong ROI from modern analytics and large productivity gains from self-service reporting.
The problem (what teams told us)
Operations, security and product teams commonly report:
- Slow reaction to incidents because data lives in different systems
- Time wasted creating recurring reports and chasing updates
- Low confidence in manual or delayed KPIs, causing reactive instead of proactive actions
- Difficulty connecting live visual data (CCTV/edge sensors) to business outcomes
Real-time, consolidated dashboards directly target these pain points by reducing cognitive and coordination friction.
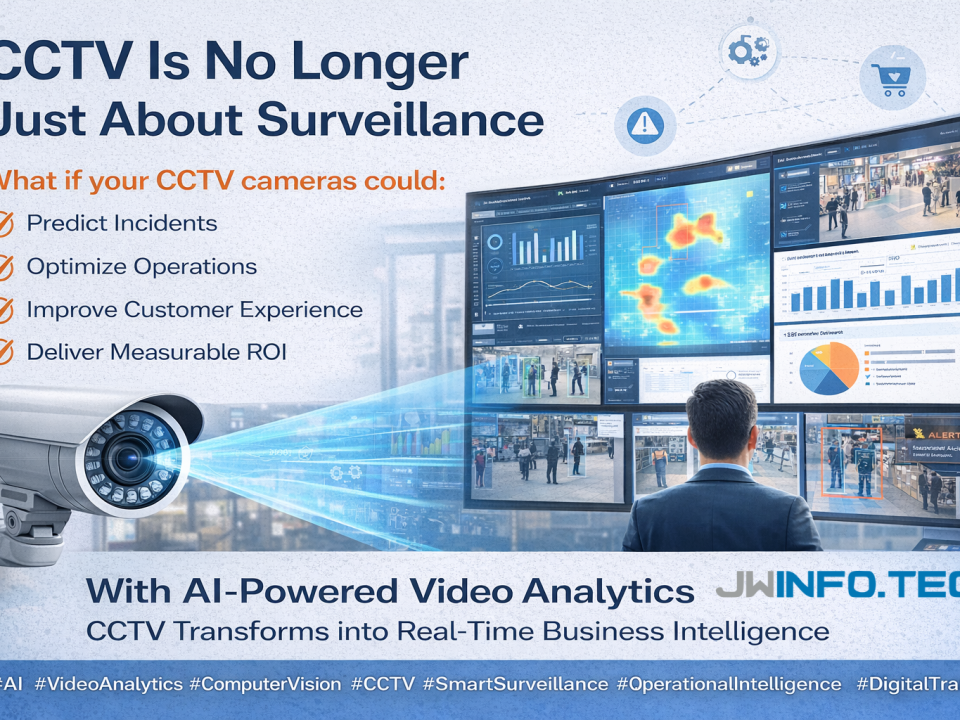
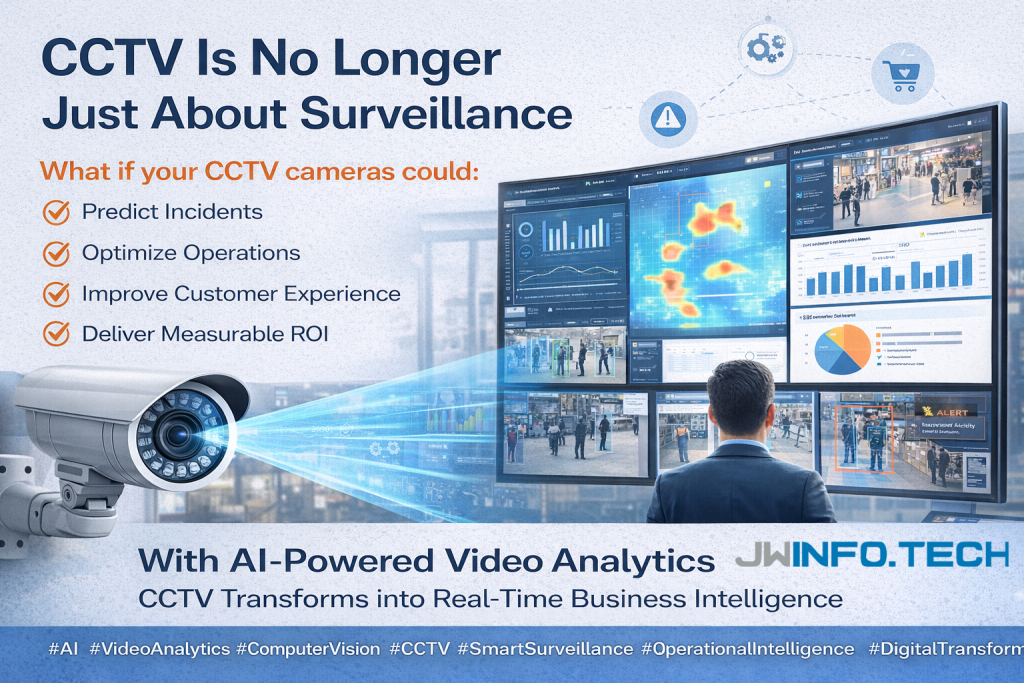
NexaSight solution (how we structure the dashboard stack)
- Data ingestion & edge pre-processing — stream, anonymize and normalize telemetry and video events so dashboards show high-quality signals (not noisy frames).
- AI layer — models run object detection, behaviour detection, anomaly scoring and predictive metrics (e.g., predicted downtime, likely inventory shortfall).
- Actionable KPIs & alerts — role-based widgets (ops, security, retail managers) with drilldowns and suggested next steps.
- Prescriptive & predictive cards — the dashboard not only reports but recommends (e.g., “Reallocate staff to Lobby A, predicted wait time exceeds SLA in 12 minutes”).
- Closed-loop verification — attach short video snippets / event proof to each KPI so decisions are auditable and verifiable.
Integrating AI models into dashboards makes them not only descriptive but predictive and prescriptive — turning passive monitoring into operational leverage.
Analytics: how dashboards change efficiency (measurable impacts)
Below are the efficiency signals organizations repeatedly observe when AI dashboards are implemented and used properly:
- Decision velocity (time-to-action): dashboards reduce detection-to-decision time by enabling real-time alerts and pre-built response flows. Studies show real-time dashboards improve response times and cross-team collaboration.
- Report creation & analyst productivity: modern analytics tools can reduce repetitive report creation by ~60–70%, freeing analysts for high-value work. Forrester/industry reports demonstrate large productivity gains and very high ROI for modern analytics platforms.
- ROI per dollar invested: combined AI+dashboard initiatives have reported multi-dollar returns per $1 invested (varies by vendor and scope)—case analyses estimate between ~$3.5–$6.2 ROI in many contexts when projects are outcome-driven.
- Operational KPIs: typical pilot results (industry benchmark ranges) — unplanned downtime ↓20–50%, inventory carrying cost ↓10–30%, and conversion/wait metrics improve by double digits when action loops are in place. These are benchmark ranges drawn from cross-industry pilots and studies.
- Decision quality & frontline empowerment: self-service analytics increase the ability of frontline staff to act without waiting on central reports; HBR and industry research link this to better, faster decisions when the tooling is well designed.
Load-bearing evidence: Forrester and Nucleus Research reviews highlight large ROI numbers for modern analytics investments and significant reductions in time spent on reporting—two critical value levers for dashboard programs.
Roles — who benefits and how
- Operations Manager: uses heatmaps and predictive alerts to reallocate staff and reduce queues.
- Security Lead: receives verified, prioritized alerts (with short clips) to reduce false positives and speed response.
- Store/Plant Manager: gets daily actionable KPIs (dwell time, throughput, reject rate) and recommended corrective actions.
- Data/Analytics Team: freed from manual report building and able to focus on model improvement and higher-value insights.
- C-Suite: receives concise outcome metrics (ROI, risk reduction, customer satisfaction uplift) for governance.
Implementation roadmap (pilot → scale)
- Discovery (2 weeks): identify 2–3 high-impact use cases, define success metrics (time-to-action, cost per incident, % waste).
- Pilot (6–8 weeks): deploy edge sensors + model for 1 use case (e.g., queue detection or predictive maintenance), build dashboard widgets and alert flows.
- Validate (4 weeks): measure against baseline KPIs; tune thresholds to minimize false positives.
- Scale (3–9 months): roll out across sites, add predictive cards, integrate with ticketing / workforce systems.
- Optimize (ongoing): model retraining, A/B testing of alert thresholds, and business process refinement.
Recommendations & best practices
- Start with outcomes, not tech. Pick 1–2 KPIs that map directly to cost or revenue.
- Design for humans. Role-based dashboards + short verification clips reduce alarm fatigue and speed trust.
- Measure continuously. Track decision velocity, analyst hours saved, and direct financial impacts to demonstrate ROI.
- Govern for privacy & accuracy. Implement edge processing, redaction, and audit trails to manage risk.
- Use a phased commercial model. Tie expansion to measured wins (pay-for-outcome or milestone payments).
AI-enabled dashboards change efficiency by converting raw streams into timely, trustworthy signals and prescriptive actions. When programs are scoped to outcomes and designed for frontline users, organizations unlock fast operational wins and strong ROI. Thoughtful pilots, role-centric design, and continuous measurement are how “seeing more” becomes “doing better.”

